Plotting Basics
Basics
Load the xts package and some sample data
library(xts)

data(sample_matrix)
sample.xts <- as.xts(sample_matrix)
Create a basic plot.
plot(sample.xts[,"Close"])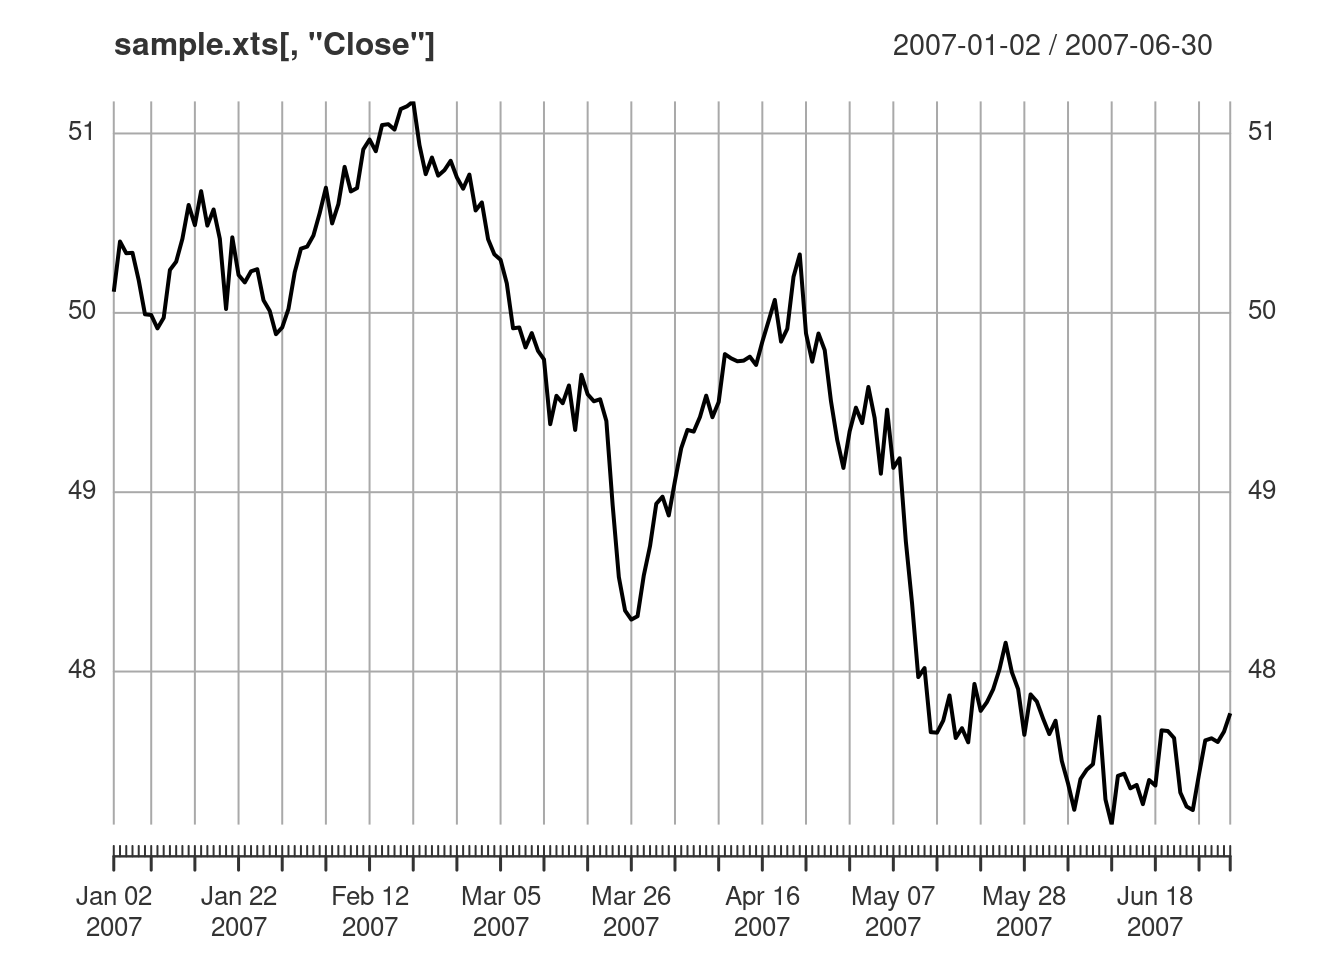
Subset to only plot March 2007. The subset argument uses xts subsetting described in ?xts.
plot(sample.xts[,"Close"], subset="2007-03")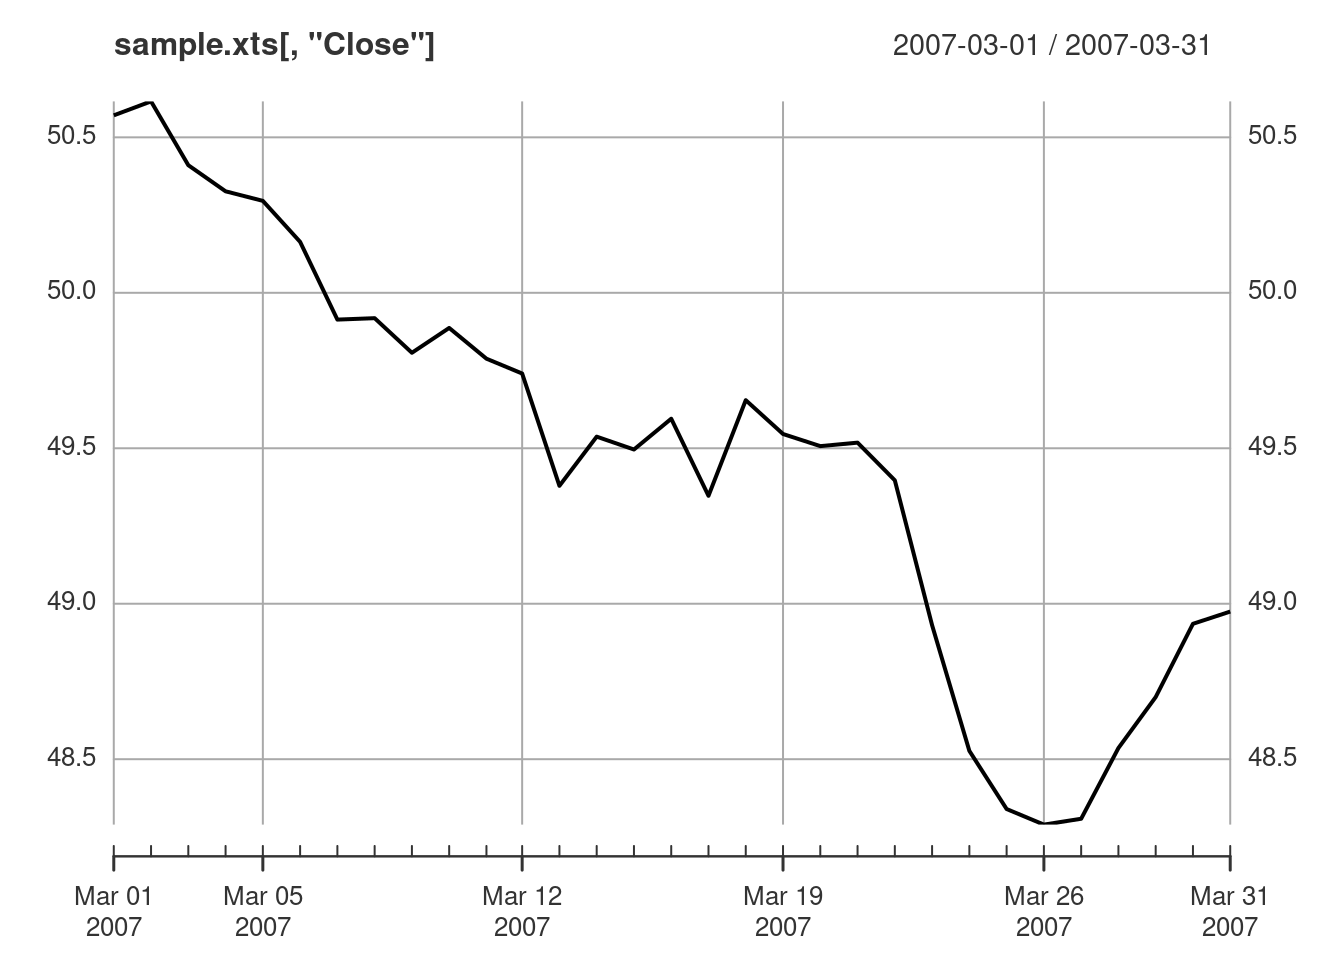
Customize the plot by changing the color (col), line type (lty), and line width (lwd). See ?par for more valid values for lty and lwd.
plot(sample.xts[,"Close"], col="blue", lwd=2, lty=2)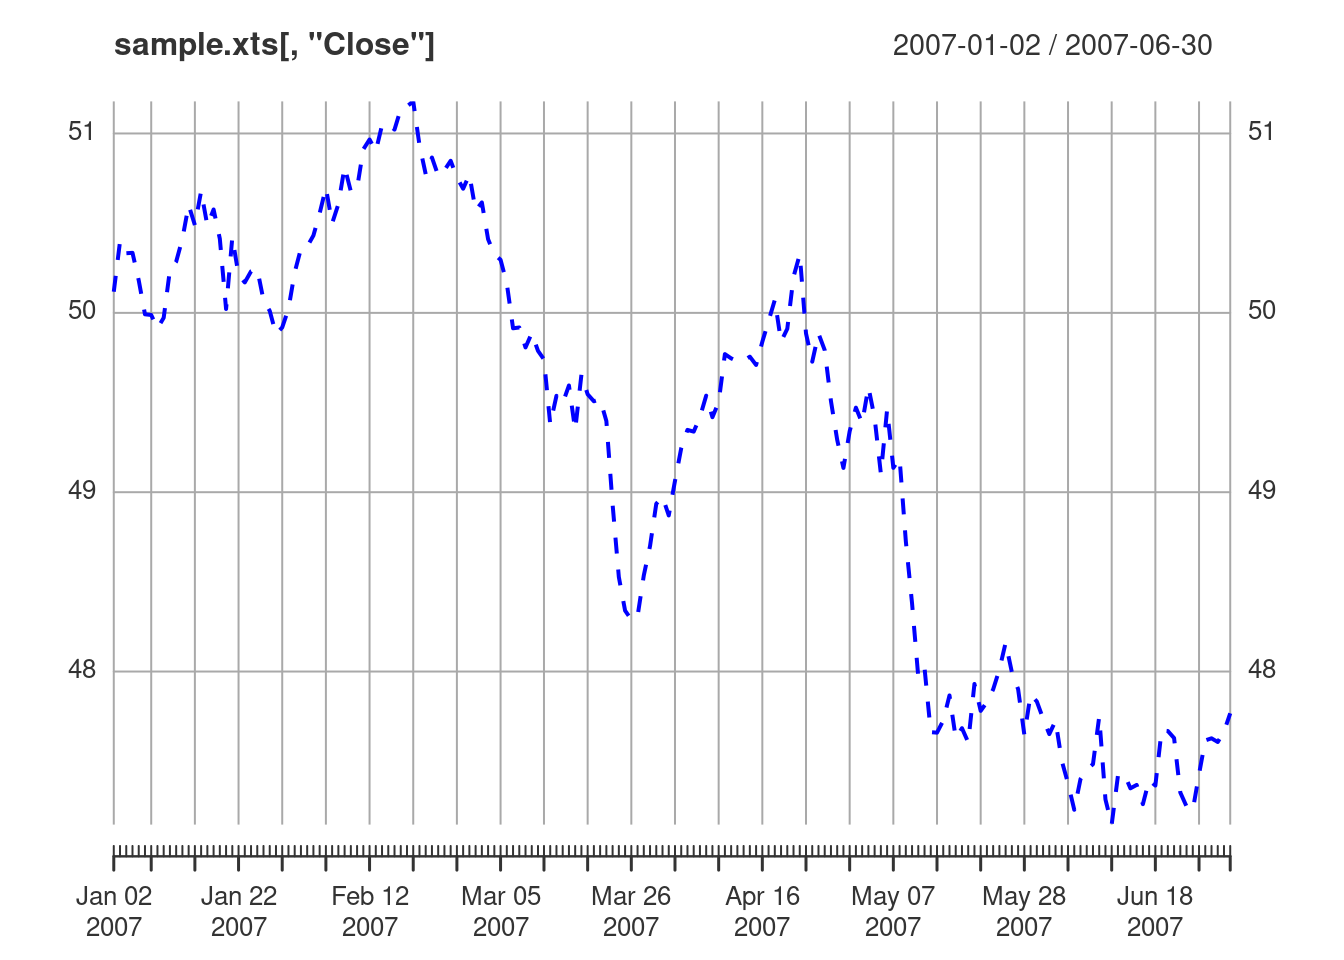
Lines
Here we start with a basic plot, then add moving average lines, and a legend. The default behavior for lines is to add to the current panel. The current panel is defined as the panel on which the most recent action was performed. Note that the default behavior for addLegend is also to add to the current panel.
plot(sample.xts[,"Close"])
lines(TTR::SMA(sample.xts[,"Close"], n = 20), col="blue")
lines(TTR::SMA(sample.xts[,"Close"], n = 50), col="red", lty=2)

# add legend to panel 1
addLegend("topright", legend.names = c("Close", "SMA(20)", "SMA(50)"),
          lty=c(1, 1, 2), lwd=c(2, 1, 1),
          col=c("black", "blue", "red"))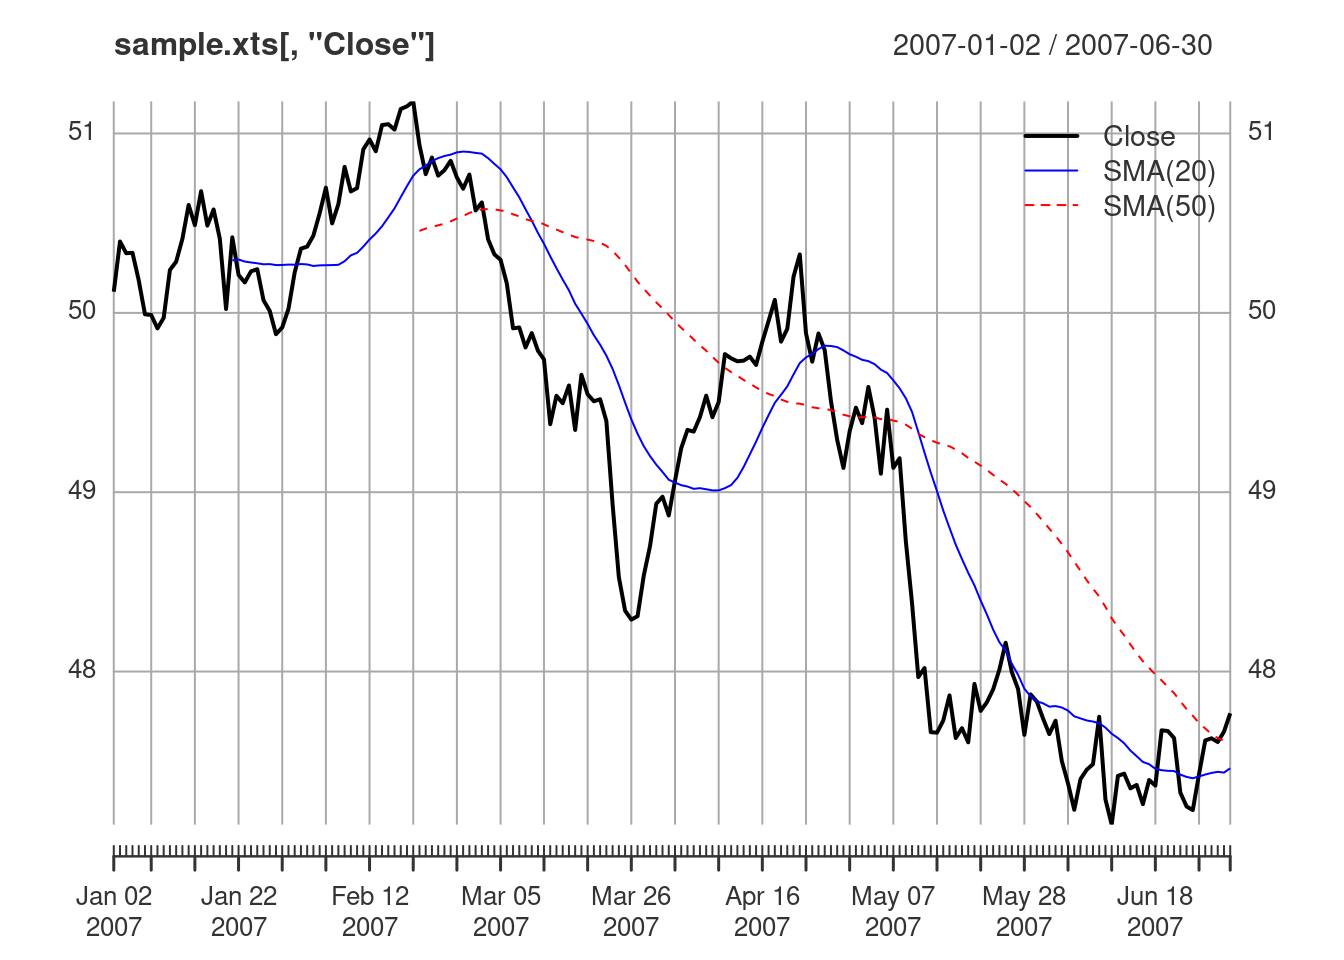
A new panel is drawn by specifying on=NA. To draw lines on a specific panel, pass an integer corresponding to the panel number to on.
plot(sample.xts[,"Close"])
# add a new panel
lines(TTR::SMA(sample.xts[,"Close"], n = 20), on=NA, col="blue")
# add a new panel
lines(TTR::SMA(sample.xts[,"Close"], n = 50), on=NA, col="red")
# draw a line on panel 3
lines(TTR::SMA(sample.xts[,"Close"], n = 60), on=3, col="darkred")
# draw a line on panel 2
lines(TTR::SMA(sample.xts[,"Close"], n = 25), on=2, col="darkblue")
# draw a line on the current panel
lines(TTR::SMA(sample.xts[,"Close"], n = 10), col="green", lty=2)
# draw a line on panel 1
lines(TTR::SMA(sample.xts[,"Close"], n = 100), on=1, col="lightblue")

# add legend to the current panel
addLegend("topright", legend.names = c("Close", "SMA(100)"),
          lty=c(1, 1), lwd=c(2, 1),
          col=c("black", "lightblue"))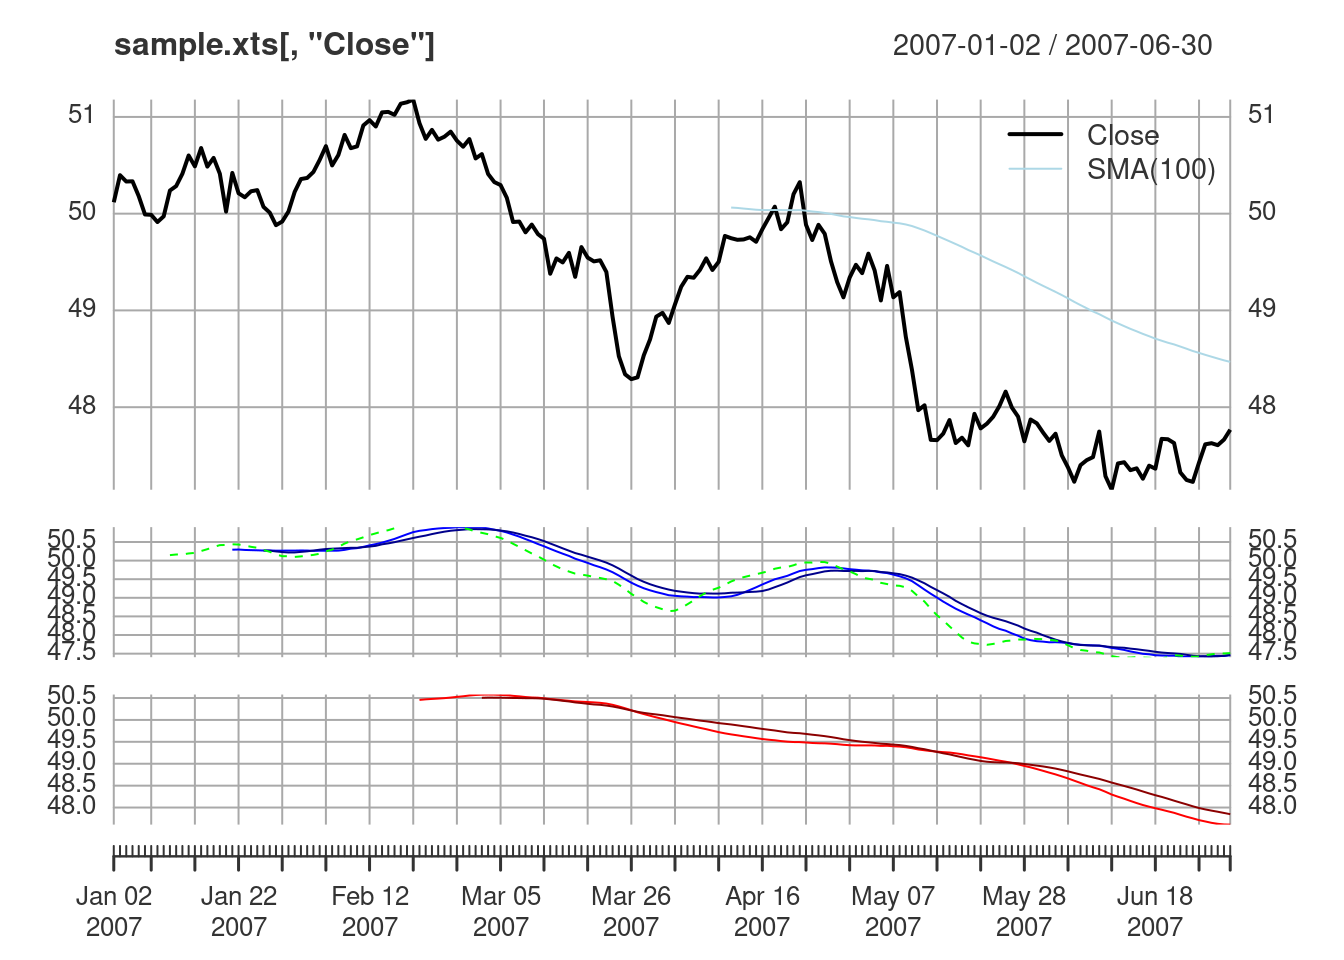
Points
We can also add points to a plot in the same way we added lines. The default behavior for points is the same as lines, which is to draw the points on on the current panel.
plot(sample.xts[,"Close"])
points(TTR::SMA(sample.xts[,"Close"], n = 20), col="blue", pch=2)
points(TTR::SMA(sample.xts[,"Close"], n = 50), col="red", pch=5)

# add legend to panel 1
addLegend("topright", legend.names = c("Close", "SMA(20)", "SMA(50)"),
          lty=c(1, NA, NA), pch=c(NA, 2, 5),
          col=c("black", "blue", "red"))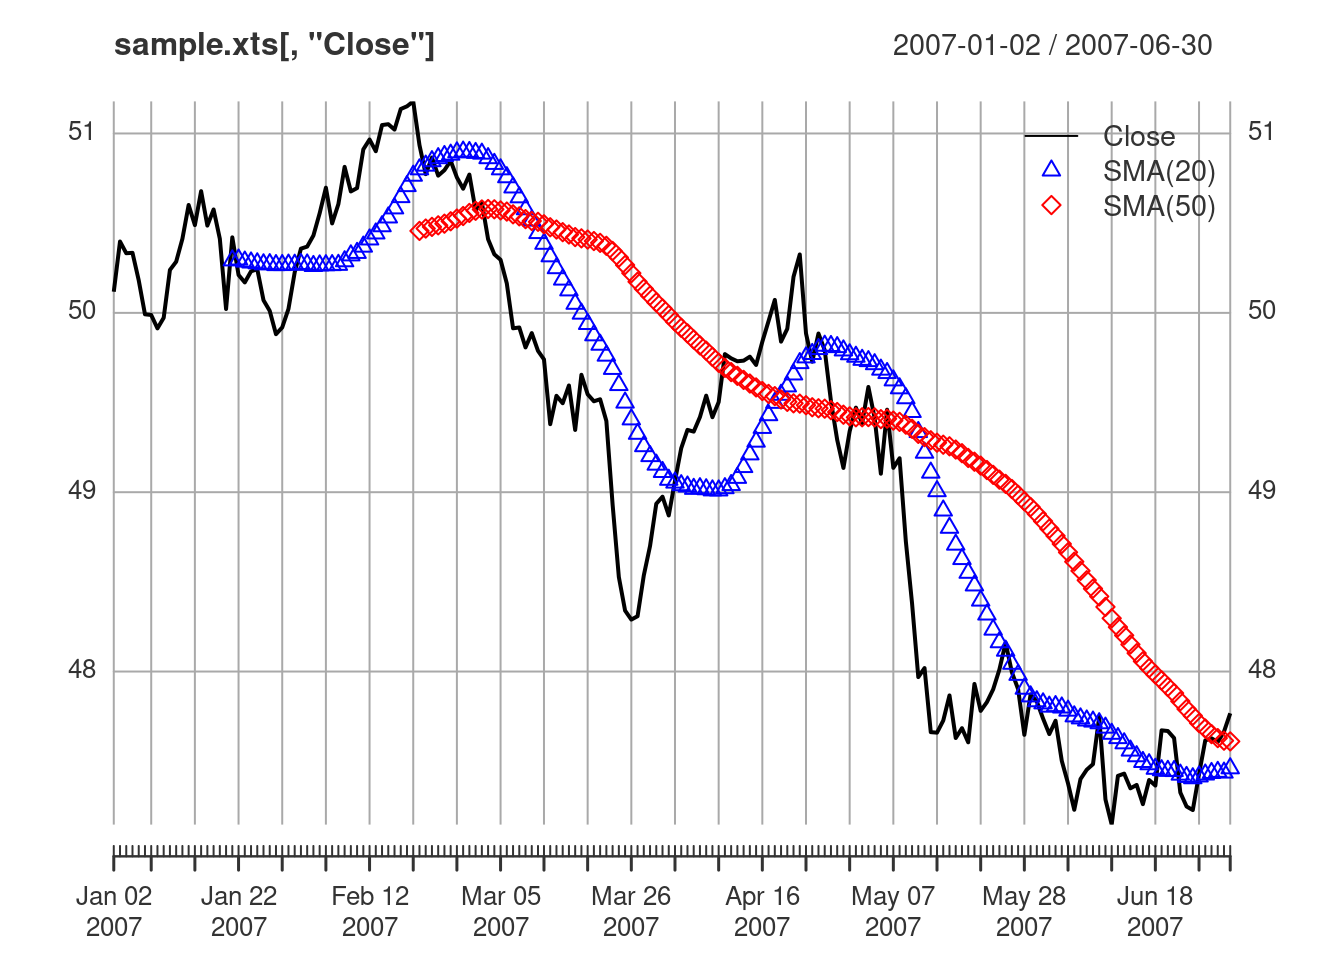
Event Lines
addEventLines will draw lines on the current panel just as in lines, points, and addLegend.
plot(sample.xts[,4])
events <- xts(c("foo", "bar"), as.Date(c("2007-03-20","2007-05-28")))
addEventLines(events)
addEventLines(events, offset=1.2, pos=2, , srt=90, cex=1.5)
addEventLines(events, offset=1.2, pos=4, , srt=-90, cex=1.5)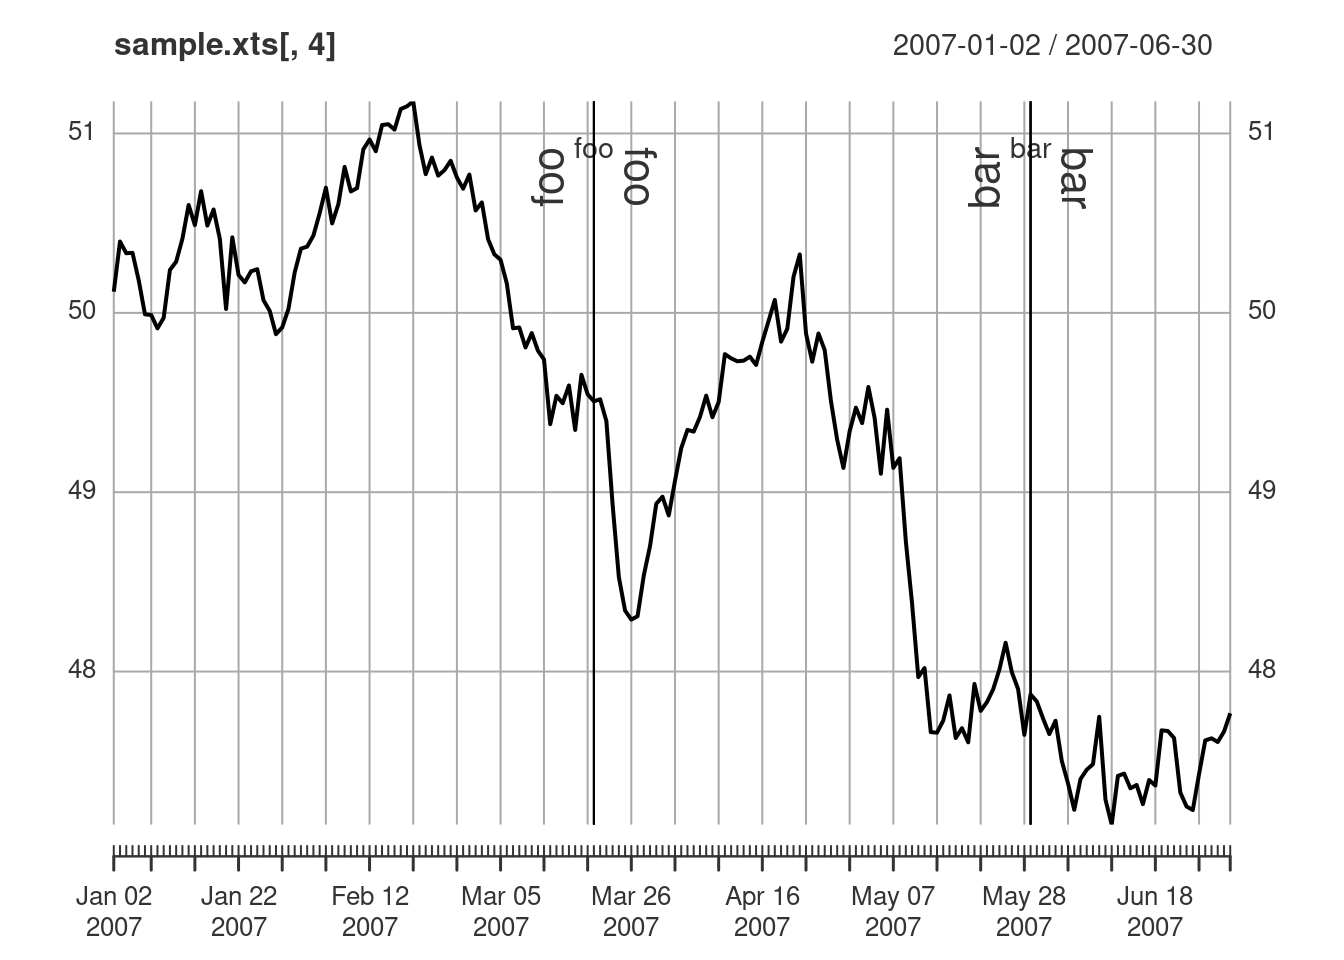
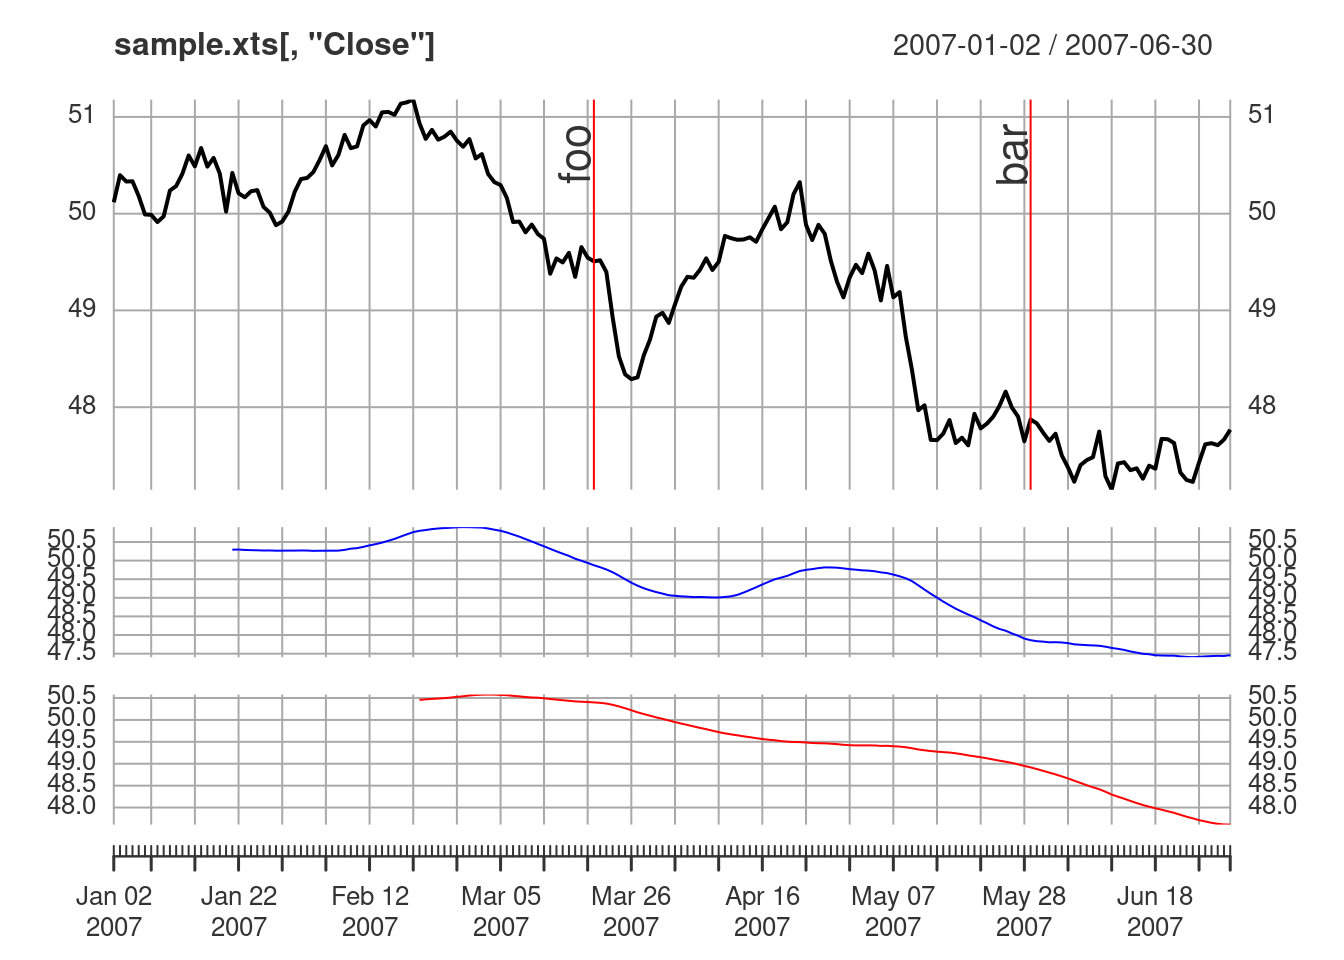
Event lines can be drawn on a specific panel by specifying an integer corresponding to the desired panel for on. A new panel is drawn if on=NA.
plot(sample.xts[,"Close"])
# add a new panel
lines(TTR::SMA(sample.xts[,"Close"], n = 20), on=NA, col="blue")
# add a new panel
lines(TTR::SMA(sample.xts[,"Close"], n = 50), on=NA, col="red")
addEventLines(events, on=1, offset=.4, pos=2, srt=90, cex=1.5, col="red")